Category:Income distribution in the United States
Countries of the Americas: United States of America
See also:
as measured by the United States Department of Commerce either by household or individual | |||||
| Upload media | |||||
| Subclass of | |||||
|---|---|---|---|---|---|
| Facet of | |||||
| |||||
Subcategories
This category has the following 7 subcategories, out of 7 total.
C
M
W
Media in category "Income distribution in the United States"
The following 200 files are in this category, out of 352 total.
(previous page) (next page)-
 1-US Household Wealth - Real and Nominal.png 1,042 × 350; 41 KB
-
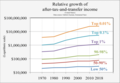 1970- Relative income growth by percentiles - US logarithmic.png 1,636 × 1,132; 237 KB
-
 1970- Relative income growth by percentiles - US.png 1,636 × 1,132; 57 KB
-
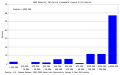
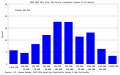
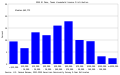
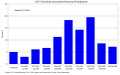
 2007 Mean income per income bracket.png 6,500 × 187; 9 KB
-
 2008 Top1percentUSA.png 980 × 720; 110 KB
-
 2008 Top1percentUSA.svg 1,022 × 720; 7 KB
-
 AdjustedWageShareUSAFRGJapan.PNG 978 × 632; 38 KB
-
 African Americans and Same Sex Couples Incomes.jpg 451 × 633; 94 KB
-
 After tax household income in the US.svg 750 × 930; 16 KB
-
 Albuquerque New Mexico household income distribution.svg 1,200 × 750; 16 KB
-
 Annual growth in family income vs tax rate.png 1,024 × 768; 42 KB
-
 Annual Income Growth by Income.png 800 × 600; 24 KB
-
 Atherton California household income distribution.svg 1,200 × 750; 16 KB
-
 Atlanta household income distribution.svg 1,200 × 750; 16 KB
-
 Austin Texas household income distribution.svg 1,200 × 750; 16 KB
-
 Average earnings of workers by education and sex - 2006.png 963 × 721; 57 KB
-
 Average State and Local Taxes for All States, 2007.jpg 715 × 430; 92 KB
-
 Baltimore household income distribution.svg 1,200 × 750; 16 KB
-
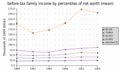 BeforetaxfamilyincomemeanUS1989-2004.png 543 × 324; 9 KB
-
 BeforetaxfamilyincomemeanUS1989-2004.svg 581 × 322; 284 KB
-
 BeforetaxfamilyincomemedianUS1989-2004.png 543 × 323; 10 KB
-
 BeforetaxfamilyincomemedianUS1989-2004.svg 573 × 323; 295 KB
-
 Biloxi Mississippi household income distribution.svg 1,200 × 750; 16 KB
-
 Boston household income distribution.svg 1,200 × 750; 16 KB
-
 CBO 1979 to 2015 Real Household Income by Income Quintile.png 1,394 × 780; 420 KB
-
 CEO pay v. average slub.png 754 × 454; 29 KB
-

-
 Changeinmeanbefore-taxincomeUS1989-2004.png 579 × 346; 4 KB
-
 Changeinmeanbefore-taxincomeUS1989-2004.svg 610 × 330; 180 KB
-
 Changeinmedianbefore-taxincomeUS1989-2004.png 579 × 346; 5 KB
-
 Charlotte North Carolina household income distribution.svg 1,200 × 750; 16 KB
-
 Chart of US Top 1% Income Share (1913-2008).svg 999 × 713; 41 KB
-

-
 Chevy Chase Maryland household income distribution.svg 1,200 × 750; 16 KB
-
 Chicago household income distribution.svg 1,200 × 750; 16 KB
-
 Cincinnati household income distribution.svg 1,200 × 750; 16 KB
-
 Class US.png 500 × 500; 151 KB
-
 Cleveland household income distribution.svg 1,200 × 750; 16 KB
-
 Columbus Ohio household income distribution.svg 1,200 × 750; 16 KB
-
 Comparing CEO Pay.png 875 × 585; 30 KB
-
 Composition revenu top 0.01 us.png 1,056 × 816; 49 KB
-
 Dallas household income distribution.svg 1,200 × 750; 16 KB
-
 Denver household income distribution.svg 1,200 × 750; 16 KB
-
 Detroit household income distribution.svg 1,200 × 750; 16 KB
-
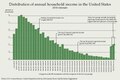
 Distribution of Annual Household Income in the United States 1993.svg 1,200 × 750; 4 KB
-
 Distribution of Annual Household Income in the United States 1994.svg 1,200 × 750; 7 KB
-
 Distribution of Annual Household Income in the United States 1995.svg 1,200 × 750; 7 KB
-
 Distribution of Annual Household Income in the United States 1996.svg 1,200 × 750; 7 KB
-
 Distribution of Annual Household Income in the United States 1997.svg 1,200 × 750; 7 KB
-
 Distribution of Annual Household Income in the United States 1998.svg 1,200 × 750; 7 KB
-
 Distribution of Annual Household Income in the United States 1999.svg 1,200 × 750; 7 KB
-
 Distribution of Annual Household Income in the United States 2000.svg 1,200 × 750; 7 KB
-
 Distribution of Annual Household Income in the United States 2001.svg 1,200 × 750; 7 KB
-
 Distribution of Annual Household Income in the United States 2002.svg 1,200 × 750; 7 KB
-
 Distribution of Annual Household Income in the United States 2003.svg 1,200 × 750; 7 KB
-
 Distribution of Annual Household Income in the United States 2004.svg 1,200 × 750; 7 KB
-
 Distribution of Annual Household Income in the United States 2005.svg 1,200 × 750; 7 KB
-
 Distribution of Annual Household Income in the United States 2006.svg 1,200 × 750; 7 KB
-
 Distribution of Annual Household Income in the United States 2007.svg 1,200 × 750; 7 KB
-
 Distribution of Annual Household Income in the United States 2008.svg 1,200 × 750; 7 KB
-
 Distribution of Annual Household Income in the United States 2009.svg 1,200 × 750; 7 KB
-
 Distribution of Annual Household Income in the United States 2010.png 3,742 × 2,510; 251 KB
-
 Distribution of Annual Household Income in the United States 2010.svg 1,200 × 750; 7 KB
-
 Distribution of Annual Household Income in the United States 2011.png 2,400 × 1,542; 146 KB
-
 Distribution of Annual Household Income in the United States 2011.svg 1,200 × 750; 7 KB
-
 Distribution of Annual Household Income in the United States 2012.svg 1,200 × 750; 7 KB
-
 Distribution of Annual Household Income in the United States 2013.svg 1,200 × 750; 7 KB
-
 Distribution of Annual Household Income in the United States 2014.svg 1,200 × 750; 7 KB
-
 Distribution of Annual Household Income in the United States 2015.svg 1,200 × 750; 7 KB
-
 Distribution of Annual Household Income in the United States 2016.svg 1,200 × 750; 7 KB
-
 Distribution of Annual Household Income in the United States.pdf 1,200 × 804; 73 KB
-
 Distribution of Average Income Growth for 99 and 1 percent.svg 800 × 600; 9 KB
-
 Distribution of Average Income Growth.svg 800 × 600; 9 KB
-
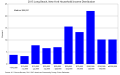
 Distribution of US and CA households by income relative to CE poverty lines.png 1,288 × 1,005; 108 KB
-
 East Palo Alto California household income distribution.svg 1,200 × 750; 16 KB
-
 East St Louis Illinois household income distribution.svg 1,200 × 750; 16 KB
-
 Effective tax rates, US high-income.png 743 × 710; 218 KB
-
 El Paso Texas household income distribution.svg 1,200 × 750; 16 KB
-
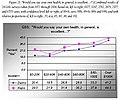 Fig. 23 - Would you say your own health is excellent.JPG 420 × 349; 33 KB
-
 Figure01-earnings by degree.gif 720 × 371; 48 KB
-
 Figure05-teachers wages.png 560 × 510; 60 KB
-
 Flint Michigan household income distribution.svg 1,200 × 750; 16 KB
-
 Fort Worth Texas household income distribution.svg 1,200 × 750; 16 KB
-
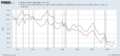 FRED graph of US labor share 1948–2016.png 969 × 450; 64 KB
-
 FRED graph of US labor share 1948–2016.svg 2,138 × 993; 125 KB
-
 Fresno California household income distribution.svg 1,200 × 750; 16 KB
-
 Gdp versus household income.png 900 × 613; 40 KB
-
 1999 earnings ratio.jpg 545 × 327; 31 KB
-
 Gilroy California household income distribution.svg 1,200 × 750; 16 KB
-
 GINI Index of the United States.png 1,382 × 792; 28 KB
-
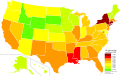 Gini United States by state 2019.svg 512 × 324; 204 KB
-
 GiniPlots USA.png 2,200 × 1,700; 30 KB
-
 Goodwin2 fredgraph.png 2,680 × 1,780; 252 KB
-
 GoodwinEmp.png 977 × 631; 61 KB
-
 Growth of after tax household income in the US.svg 750 × 560; 15 KB
-
 Hedwig Village household income distribution.svg 1,200 × 750; 16 KB
-
 Honolulu household income distribution.svg 1,200 × 750; 16 KB
-
 Household Income 1967 to 2003 in USA (PL version).png 447 × 423; 10 KB
-
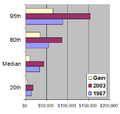 Household Income 1967 to 2003.png 447 × 423; 11 KB
-
 Household Income Distribution in the US.svg 750 × 540; 16 KB
-
 Houston household income distribution.svg 1,200 × 750; 16 KB
-
 Hunters Creek Village Texas household income distribution.svg 1,200 × 750; 16 KB
-
 Income America.png 653 × 428; 6 KB
-
 Income Education 91 to 03.jpg 816 × 340; 132 KB
-
 Income inequality panel - v1.png 1,309 × 733; 298 KB
-
 Income inequality, OWID.svg 850 × 600; 6 KB
-
 Income inequity US (PL version).png 505 × 307; 6 KB
-
 Income inequity US.png 505 × 307; 9 KB
-
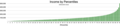 Income percentile.webp 1,557 × 331; 43 KB
-
 Income profession.png 421 × 302; 9 KB
-
 Income Ranking by Religious Group - 2000-ar.png 797 × 593; 116 KB
-
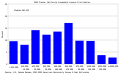
 Income Ranking by Religious Group - 2000.png 915 × 678; 67 KB
-
 Income shares by quintile, OWID.svg 850 × 600; 10 KB
-
 Income-curve-$10k.png 910 × 314; 6 KB
-
 IncomeInequality.svg 630 × 450; 112 KB
-
 IncomeInequality7.svg 630 × 630; 116 KB
-
 IncomeInequality8square.svg 630 × 630; 112 KB
-
 IncomeInequality9b.svg 630 × 630; 126 KB
-
 IncomeRedistributionOnHouseholdSpending.png 991 × 526; 30 KB
-
 Indianapolis Indiana household income distribution.svg 1,200 × 750; 16 KB
-
 Inequality-by-Kenworthy.png 354 × 441; 27 KB
-
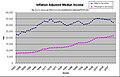 InflationAdjustedMedianIncomeHistory.jpg 797 × 511; 43 KB
-
 Jacksonville Florida household income distribution.svg 1,200 × 750; 16 KB
-
 Kansas City Kansas household income distribution.svg 1,200 × 750; 16 KB
-
 Kansas City Missouri household income distribution.svg 1,200 × 750; 16 KB
-
 Las Vegas household income distribution.svg 1,200 × 750; 16 KB
-
 LohnquUSAJBRD.PNG 970 × 604; 51 KB
-
 LohnquUSAJBRD2.PNG 970 × 604; 41 KB
-
 Long Beach California household income distribution.svg 1,200 × 750; 16 KB
-
 Long Beach New York household income distribution.svg 1,200 × 750; 16 KB
-
 Lorenz curve.png 880 × 742; 6 KB
-
 Los Angeles household income distribution.svg 1,200 × 750; 16 KB
-
 Louisville Kentucky household income distribution.svg 1,200 × 750; 16 KB
-
 Macon Mississippi household income distribution.svg 1,200 × 750; 16 KB
-
 Median family income growth by top tax rate.svg 800 × 600; 13 KB
-

-

-

-
 Median US household income through 2018.png 1,168 × 450; 48 KB
-
 Median US household income.png 1,104 × 435; 33 KB
-
 Memphis Tennessee household income distribution.svg 1,200 × 750; 16 KB
-
 Miami household income distribution.svg 1,200 × 750; 16 KB
-
 Middle class shrinkage.png 4,814 × 1,812; 377 KB
-
 Milwaukee household income distribution.svg 1,200 × 750; 16 KB
-
 Minneapolis household income distribution.svg 1,200 × 750; 16 KB
-
 Mount Kisco New York household income distribution.svg 1,200 × 750; 16 KB
-
 Nashville Tennessee household income distribution.svg 1,200 × 750; 16 KB
-
 New Orleans household income distribution.svg 1,200 × 750; 16 KB
-
 New York City household income distribution.svg 1,200 × 750; 16 KB
-
 Newark New Jersey household income distribution.svg 1,200 × 750; 16 KB
-
 Nh communities by population.png 720 × 1,207; 249 KB
-
 NHMedianHouseholdIncome1519.png 640 × 1,207; 247 KB
-
 Oklahoma City household income distribution.svg 1,200 × 750; 16 KB
-
 OnePercentShareOfIncome TotalUSdebt.jpg 3,713 × 3,095; 3.36 MB
-
 Orlando household income distribution.svg 1,200 × 750; 16 KB
-
 Palo Alto household income distribution.svg 1,200 × 750; 16 KB
-
 Per capita US income.png 565 × 319; 17 KB
-
 Percent of Income from Capital Gains and Dividends (2006).gif 396 × 291; 10 KB
-

-
 Personal income.png 491 × 388; 17 KB
-
 Philadelphia household income distribution.svg 1,200 × 750; 16 KB
-
 Phoenix household income distribution.svg 1,200 × 750; 16 KB
-
 Piketty top decile share national income en.png 605 × 517; 36 KB
-
 Piketty top decile share national income nl.png 605 × 517; 35 KB
-
 Piney Point Village Texas household income distribution.svg 1,200 × 750; 16 KB
-
 Pittsburgh household income distribution.svg 1,200 × 750; 16 KB
-
 Portland Oregon household income distribution.svg 1,200 × 750; 16 KB
-

-
 Productivity and Real Median Family Income Growth 1947-2009.png 640 × 398; 115 KB
-
 Productivity and Real Median Family Income Growth in the United States.png 1,024 × 768; 39 KB
-
 Race 6 figure household and.png 424 × 304; 10 KB
-
 Race Income.png 400 × 301; 9 KB
-
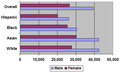
 Racial Earnings Comparison.png 592 × 408; 117 KB
-
 Real GDP, Real Wages and Trade Policies in the U.S. (1947– 2014).png 861 × 691; 81 KB
-
 Real median US household income through 2018.png 1,168 × 450; 56 KB
-
 Real Wages vs Trade Percent of GDP.svg 824 × 518; 177 KB
-
 Revenu top 10 us.png 480 × 347; 23 KB
-
 Salt Lake City household income distribution.svg 1,200 × 750; 16 KB
-
 San Antonio household income distribution.svg 1,200 × 750; 16 KB
-
 San Diego household income distribution.svg 1,200 × 750; 16 KB
-
 San Francisco household income distribution.svg 1,200 × 750; 16 KB
-
 San Jose household income distribution.svg 1,200 × 750; 16 KB
-
 Scarsdale New York household income distribution.svg 1,200 × 750; 16 KB
-
 Seattle household income distribution.svg 1,200 × 750; 16 KB
-
 Share of after tax household income in the US.svg 750 × 560; 14 KB
-
 Share top 1 percent (PL version).jpg 602 × 239; 100 KB
-
 Share top 1 percent.jpg 602 × 239; 63 KB
-
 Share top 1 percent.svg 750 × 560; 18 KB
-
 Share top 10 percent.svg 750 × 560; 17 KB
-
 Short Hills New Jersey household income distribution.svg 1,200 × 750; 16 KB
-
 Society Hill Piscataway.jpg 994 × 491; 84 KB
-
 St Louis household income distribution.svg 1,200 × 750; 16 KB
-
 Stamford Connecticut household income distribution.svg 1,200 × 750; 16 KB
-
 TenaflyIncome.png 999 × 466; 19 KB
-
 The Great Gatsby Curve.png 1,016 × 862; 14 KB
-
 Top five percent income growth by top tax rate.svg 800 × 600; 13 KB
-
 Top one hundreth of one percent income growth by top tax rate.svg 800 × 600; 13 KB
-
 Top one percent income growth by top tax rate.svg 800 × 600; 13 KB
-
 Top ten percent income growth by top tax rate.svg 800 × 600; 13 KB
-
 Total Income Top1 (1916-2006).jpg 880 × 620; 67 KB


.png)


.svg)


.png)


.png)


.png)


.gif)
.svg)


.png)


.jpg)
.jpg)