File:Atomic-Force-Microscopy-Protocol-for-Measurement-of-Membrane-Plasticity-and-Extracellular-Video1.ogv
Size of this JPG preview of this OGG file: 800 × 600 pixels. Other resolutions: 320 × 240 pixels | 640 × 480 pixels | 1,024 × 768 pixels | 1,280 × 960 pixels | 1,440 × 1,080 pixels.
Original file (Ogg multiplexed audio/video file, Theora/Vorbis, length 28 s, 1,440 × 1,080 pixels, 404 kbps overall, file size: 1.35 MB)
Captions
Captions
Add a one-line explanation of what this file represents
Summary
edit| Description |
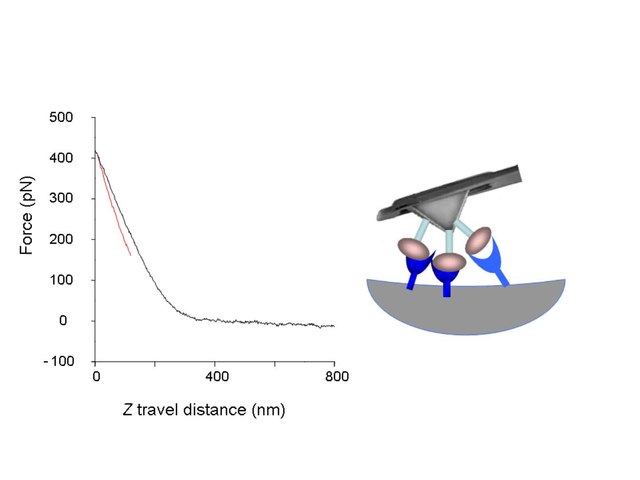
English: Represents contact force mode recording (available in online version). Raw force curves generated using FN-coated AFM probe (also see Figure 2 for details). FN-coated cantilever (1 mg/ml) were controlled to repeatedly approach (black trace) and retract (red trace) from cell while xy-axes fixed (right panel). The snap-off that represents bond rupture, termed adhesion force (left panel raw red traces). The example trace shows 3 adhesion events (bond rupture) between FN ligand (gradient brown circle under gray AFM probe in right panel) and 3-integrin receptors (gradient blue Y-shape) in the cell that occurred when the FN coated-probe retracted. |
||
| Date | |||
| Source | Video 1 from Wu X, Muthuchamy M, Reddy D (2016). "Atomic Force Microscopy Protocol for Measurement of Membrane Plasticity and Extracellular Interactions in Single Neurons in Epilepsy". Frontiers in Aging Neuroscience. DOI:10.3389/fnagi.2016.00088. PMID 27199735. PMC: 4854888. | ||
| Author | Wu X, Muthuchamy M, Reddy D | ||
| Permission (Reusing this file) |
This file is licensed under the Creative Commons Attribution 4.0 International license.
|
||
| Provenance |
|
File history
Click on a date/time to view the file as it appeared at that time.
| Date/Time | Thumbnail | Dimensions | User | Comment | |
|---|---|---|---|---|---|
| current | 01:13, 23 May 2016 | 28 s, 1,440 × 1,080 (1.35 MB) | Open Access Media Importer Bot (talk | contribs) | Automatically uploaded media file from Open Access source. Please report problems or suggestions here. |
You cannot overwrite this file.
File usage on Commons
The following page uses this file: