File:Global sea level rise from 1992 to 2020, satellite data chart.svg

Size of this PNG preview of this SVG file: 800 × 540 pixels. Other resolutions: 320 × 216 pixels | 640 × 432 pixels | 1,024 × 691 pixels | 1,280 × 864 pixels | 2,560 × 1,728 pixels.
Original file (SVG file, nominally 800 × 540 pixels, file size: 59 KB)
Captions
Captions
Add a one-line explanation of what this file represents
Summary edit
| Description |
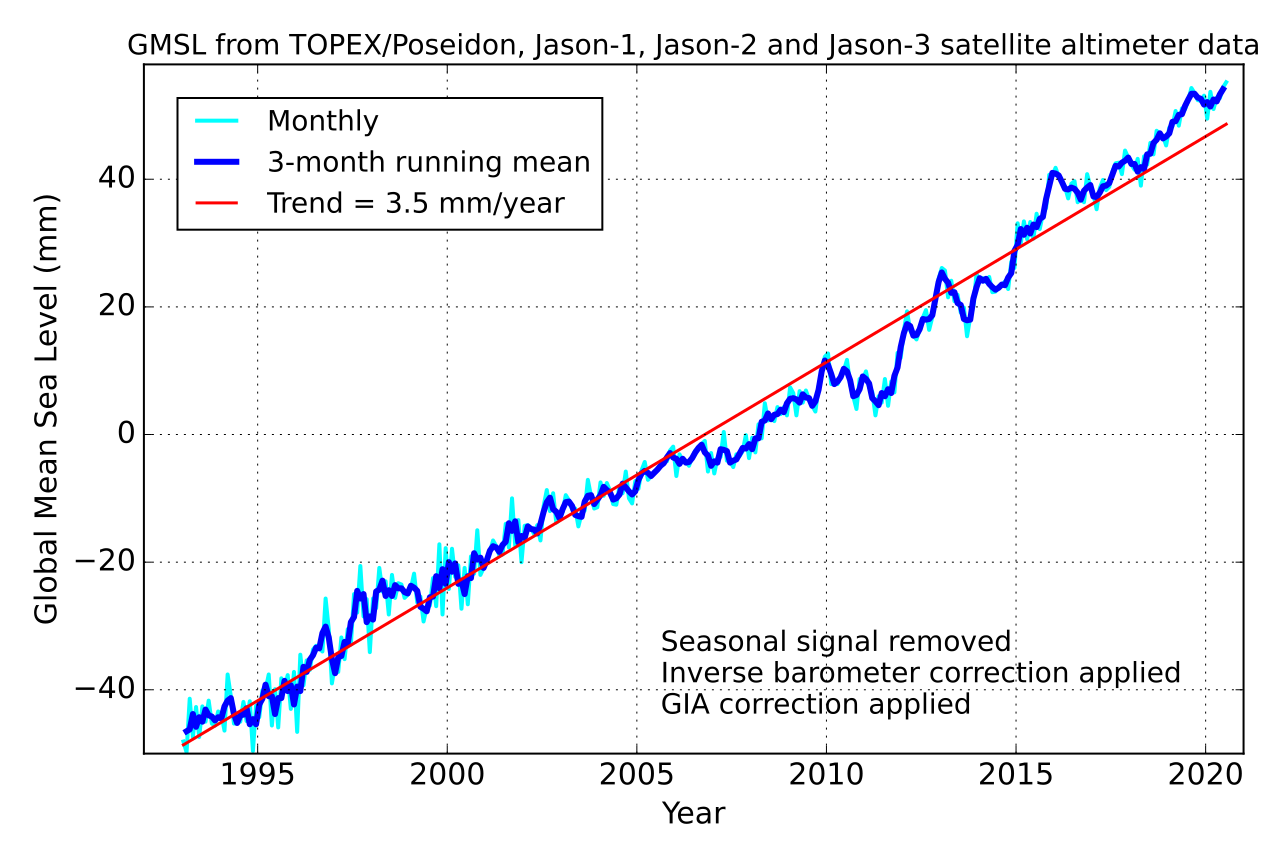
English: The image shows the development of global sea level from 1992 to 2020. Seasonal variations were removed. Measurements have been conducted via satellites TOPEX/Poseidon, Jason-1 and Jason 2. The trend line clearly shows the constant increase in global sea level of 3.5 ± 0.3 mm/year since the 1990s. The raw data is from http://www.cmar.csiro.au/sealevel/sl_hist_last_decades.html . |
| Date | |
| Source | Own work |
| Author | Geek3 |
| Other versions | Alt gmsl seas not rem.svg with seasonal variations not removed. |
| SVG development | This plot was created with Matplotlib. |
| Source code | Python code#! /usr/bin/env python
# -*- coding:utf8 -*-
import matplotlib.pyplot as plt
import numpy as np
from scipy import stats
from math import *
plt.style.use('classic')
# download data from ftp://ftp.marine.csiro.au/pub/legresy/gmsl_files/CSIRO_Alt.csv
data = []
with open('CSIRO_Alt.csv', 'r') as csv:
for txt in csv.readlines():
try:
line = [i.strip() for i in txt.split(',')]
if len(line) == 3:
data.append(line)
except Exception:
pass
years0, h0 = [], []
years1, h1 = [], []
for d in data:
try:
y, h = float(d[0]), float(d[1])
years0.append(y); h0.append(h)
except Exception:
pass
try:
y, h = float(d[0]), float(d[2])
years1.append(y); h1.append(h)
except Exception:
pass
years0 = np.array(years0)
slope, intercept, r_value, p_value, std_err = stats.linregress(years0, h0)
plt.rc('font', size=15)
fig = plt.figure(figsize=(800 / 90.0, 540 / 90.0), dpi=72)
plt.plot(years0, h0, '-', color='#00eeee', linewidth=2, label='Monthly')
plt.plot(years1, h1, '-', color='#0000dd', linewidth=3, label='3-month running mean')
plt.plot(years0[[0,-1]], intercept+slope*np.array(years0[[0,-1]]), '-',
color='red', linewidth=1.5, label='Trend = {:.1f} mm/year'.format(slope))
plt.grid(True)
plt.xlim(1992, ceil(max(years0)/1.)*1.)
plt.gca().ticklabel_format(useOffset=False)
plt.ylim(-50, 59)
plt.gca().ticklabel_format(useOffset=False)
plt.xlabel('Year')
plt.ylabel('Global Mean Sea Level (mm)')
plt.title('GMSL from TOPEX/Poseidon, Jason-1, Jason-2 and Jason-3 satellite altimeter data', size=14)
plt.legend(loc='upper left', prop={'size':14}, borderaxespad=1.2)
plt.text(0.47, 0.058, '''Seasonal signal removed
Inverse barometer correction applied
GIA correction applied''', size=14, transform=plt.gca().transAxes)
plt.tight_layout()
plt.savefig('Alt_gmsl_seas_rem.svg')
|

|
This file may be updated to reflect new information. If you wish to use a specific version of the file without new updates being mirrored, please upload the required version as a separate file. |
Licensing edit
I, the copyright holder of this work, hereby publish it under the following license:
This file is licensed under the Creative Commons Attribution-Share Alike 4.0 International license.
- You are free:
- to share – to copy, distribute and transmit the work
- to remix – to adapt the work
- Under the following conditions:
- attribution – You must give appropriate credit, provide a link to the license, and indicate if changes were made. You may do so in any reasonable manner, but not in any way that suggests the licensor endorses you or your use.
- share alike – If you remix, transform, or build upon the material, you must distribute your contributions under the same or compatible license as the original.
File history
Click on a date/time to view the file as it appeared at that time.
| Date/Time | Thumbnail | Dimensions | User | Comment | |
|---|---|---|---|---|---|
| current | 13:57, 22 September 2023 | | 800 × 540 (59 KB) | Geek3 (talk | contribs) | fix problem with x ticklabels |
| 13:54, 22 September 2023 |  | 800 × 540 (58 KB) | Geek3 (talk | contribs) | data update 2020 | |
| 13:19, 18 February 2019 |  | 800 × 540 (67 KB) | Geek3 (talk | contribs) | update 2018 | |
| 19:02, 8 April 2018 |  | 800 × 540 (69 KB) | Geek3 (talk | contribs) | User created page with UploadWizard |
You cannot overwrite this file.
File usage on Commons
The following 2 pages use this file:
- File:Alt gmsl seas rem.jpg
- File:Alt gmsl seas rem.svg (file redirect)
File usage on other wikis
The following other wikis use this file:
- Usage on de.wikipedia.org