File:Timeline of average effective tax rates of 400 richest families and bottom 50% of US households.png
Size of this preview: 582 × 599 pixels. Other resolutions: 233 × 240 pixels | 466 × 480 pixels | 746 × 768 pixels | 1,024 × 1,054 pixels.
Original file (1,024 × 1,054 pixels, file size: 385 KB, MIME type: image/png)
Captions
Captions
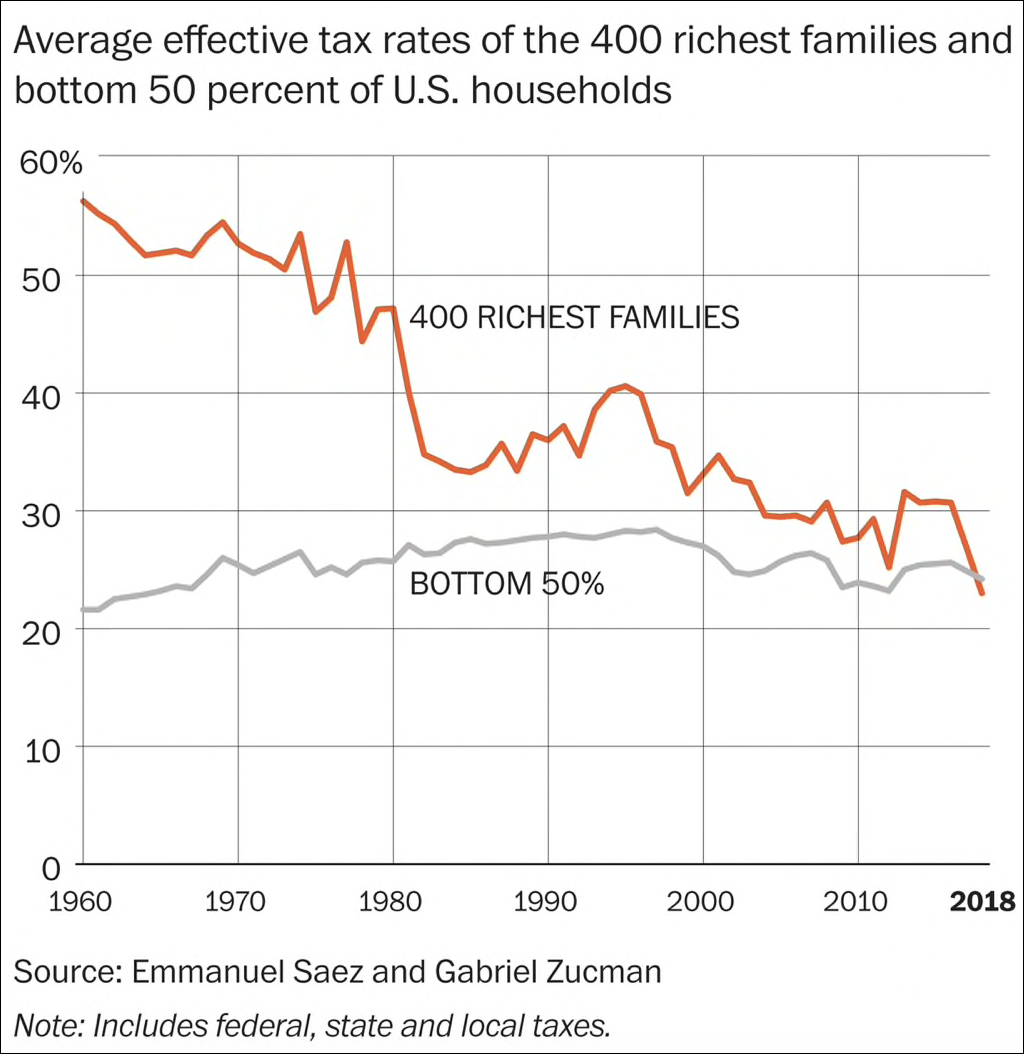
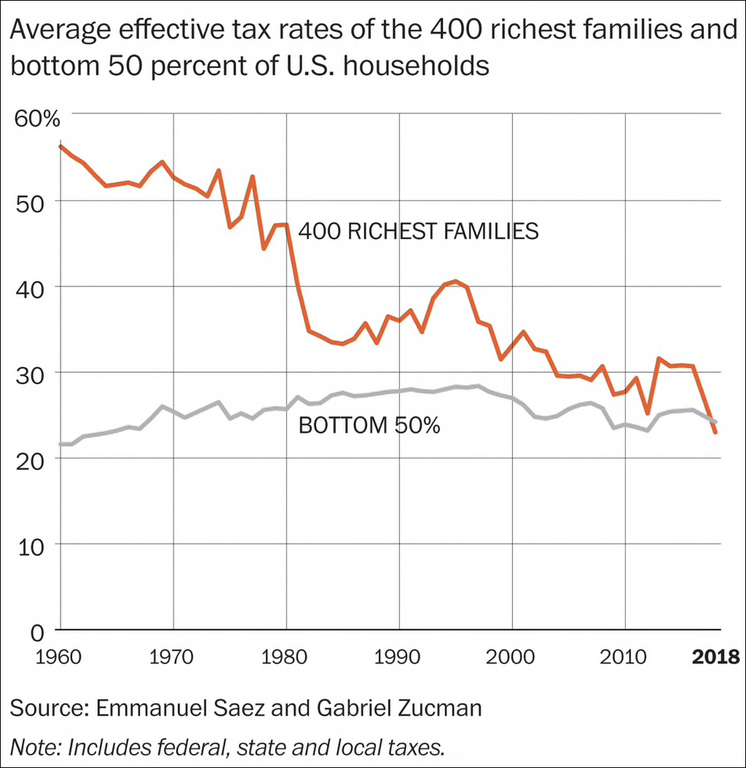
Timeline of average effective tax rates of 400 richest familes and bottom 50% of US houeholds.
Summary
edit
| Description |
English: Timeline of average effective tax rates of 400 richest familes and bottom 50% of US houeholds. Includes federal, state, and local taxes. |
| Date | - date of first upload to the Commons. See file history for latest upload date. |
| Source | Making History: U.S. Billionaires Paid Lower Tax Rate Than Working Class. October 10, 2019. On FAIR360.com. Sources listed on graph: Emmanual Saez and Gabriel Zucman. |
| Author | Unknown author |
Licensing
edit
| This map is ineligible for copyright and therefore in the public domain, because it consists entirely of information that is common property and contains no original authorship. For more information, see Commons:Threshold of originality § Maps.
|
File history
Click on a date/time to view the file as it appeared at that time.
| Date/Time | Thumbnail | Dimensions | User | Comment | |
|---|---|---|---|---|---|
| current | 07:24, 5 May 2024 | | 1,024 × 1,054 (385 KB) | Timeshifter (talk | contribs) | Uploaded a work by {{Unknown|author}} from https://www.fair360.com/making-history-u-s-billionaires-paid-lower-tax-rate-than-working-class-2 with UploadWizard |
You cannot overwrite this file.
File usage on Commons
There are no pages that use this file.
File usage on other wikis
The following other wikis use this file:
- Usage on en.wikipedia.org
- Usage on es.wikipedia.org