Kopiersperre
|

SVG images edit
These are much harder to create, depending on how they are created, but have the advantage for almost every chart that they are scaleable, in a lossless manner. The easiest way I use to create them is in Gnumeric, and simply export them as an SVG. Unfortunately there is little control over legend placement in particular, but they can be created in only a few minutes. To translate to other languages, I use the same chart in Gnumeric, and just change the column headings to change the legend. That leaves only the titles to change manually. I make a list of all the languages and translations so that if the data is updated I can re-create the different language charts easily. An example of this is File:Annual electricity net generation in the world.svg (an update of an existing chart).
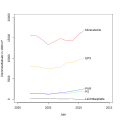
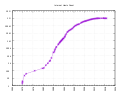
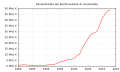
The first SVG charts I created, and the method I prefer, is to create them by hand from any similar PD chart that I find, and just change each element by hand. A good one to use for this is File:Global Wind Power Cumulative Capacity.svg because several people worked on it, cleaning up the SVG, and adding multiple languages. I prefer SVG that is created in Notepad, with a scale element that allows the data to be in the chart, in a manner that can be updated easily by anyone. The only difficulty is adding additional years, which may require re-scaling the chart, and recalculating the location of the year legends. I work on each element one at a time. I get the starting and finishing legends located properly, then scale the intermediate ones.
For example, in the above chart, the starting point is 1996 at 18, and the end point is 2013 at 683. To add another year, the chart needs to be scaled slightly differently, but once the end point at 683 was determined, and the starting point was at 18, with 17 dates, divide (683 - 18) by 17 = 39.11. Add 39 to each location, locating them at 18, 57, 96, 135, 174, 213, 252, 291, 330, 369, 408, 447, 486, 525, 564, 603, 642, 683. These were adjusted by hand to 18, 57, 96, 136, 175, 214, 253, 292, 331, 371, 410, 449, 488, 527, 566, 605, 644, 683. With line charts it is easy and convenient, often, to use for example, 2015 as the end point of the chart, so that data for 2014 and 2015 can be later added without any need to change the scaling each time.
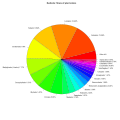
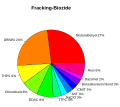
There is an odd problem with right to left languages that may need to be addressed, by adding ‎ or ‏ for example to get the percent sign to appear to the left of a number, or something similar. See, for example, the source code of File:World energy consumption by fuel.svg. This was the first pie chart I created in SVG, and hopefully has enough information in the comments to see how to calculate the data points in a spread sheet to create the pie chart.
There are two templates that can be used to create SVG charts. A simple one, Template:SVG Chart, which was used for File:World energy consumption.svg, and a more complicated one that is under development. In both cases you create a meta source file, which for example, is added to the talk page for the file you are creating, by clicking edit, and then after saving it, the SVG source code is created. I use "show preview" until I am certain that I have created the final SVG code which will be used. I create a local file using Notepad, and preview it either in Inkscape, or in any browser, which is actually better. Wikimedia, though has some rendering errors, so after the file is uploaded, it might not look the same. To create a file name in Notepad it is necessary to put the full filename inside quotes, such as "World energy consumption.svg" or else you will actually create a useless file named "World energy consumption.svg.txt".
Both Help:SVG and the examples at SVG examples are very useful. And of course help is also available from everyone else if needed.
Images edit
Diagrams edit
Own edit
-

-

-
-

-

-

-

-

-

-
-

-
-
-

-
 Armutskarte London.png Poverty map of London (PD-100)
 -

-

-

-

-

-

-

-

-

-
-
-

-
-

-

-
-

-

-
-

-
-
-


.svg)


Just updated edit


.svg)


Wiki statistics edit


Music Sheets edit


Translations edit


.svg)


[..]
<switch> translations edit


_par_proc%C3%A9d%C3%A9s_Midrex_HYL_Charbon.svg)


Screenshots edit


Schemes edit


.svg)
.svg)


Chemistry edit


[...]


.svg)


.jpg)


